


Introduction
Defining metrics is at the heart of every successful product development journey. Without clear, measurable indicators, teams drift in a sea of opinions, uncertain what drives progress and customer delight. This guide offers a step-by-step approach for product managers to align strategic goals, user needs, and data signals into actionable benchmarks. By mastering defining metrics, you’ll lead your team with confidence, fuel continuous improvement, and showcase product impact to stakeholders.
Establishing KPIs: Why Metrics Matter
When you begin defining metrics, you transform abstract objectives into quantifiable goals. Key performance indicators (KPIs) act as guiding stars, aligning cross-functional teams around shared purpose. A well-defined KPI framework helps you:
- Ensure alignment with business objectives
- Prioritize features that drive value
- Demonstrate progress to executives and investors
By establishing KPIs early, you prevent wasted effort on vanity metrics and focus on measures that truly matter.
Aligning Metrics with Business Goals
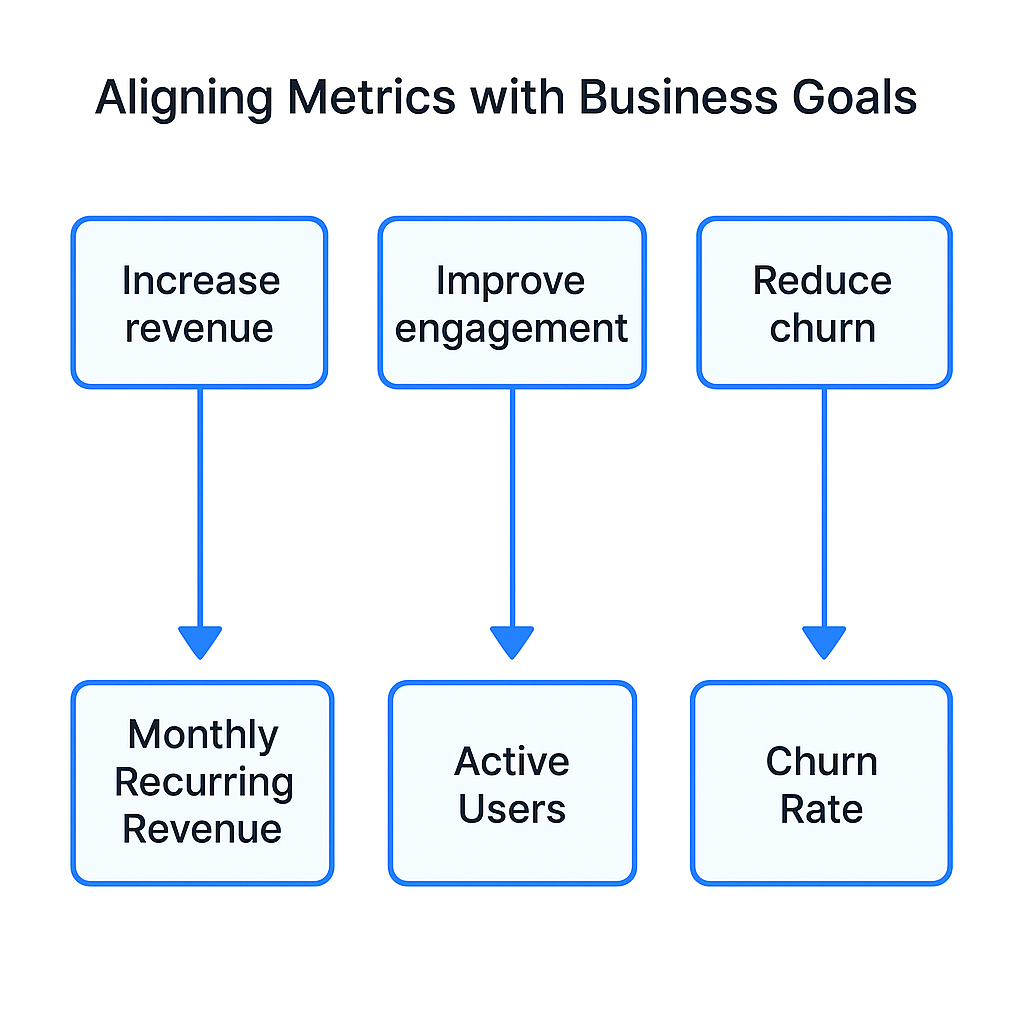
When you begin aligning metrics with business goals, you chart a clear path from strategic vision to day-to-day execution. This process ensures every KPI directly contributes to organizational priorities—whether that’s driving revenue, boosting user engagement, reducing churn or improving operational efficiency. By anchoring your performance measures in overarching objectives, you turn abstract aspirations into actionable data-driven decisions.
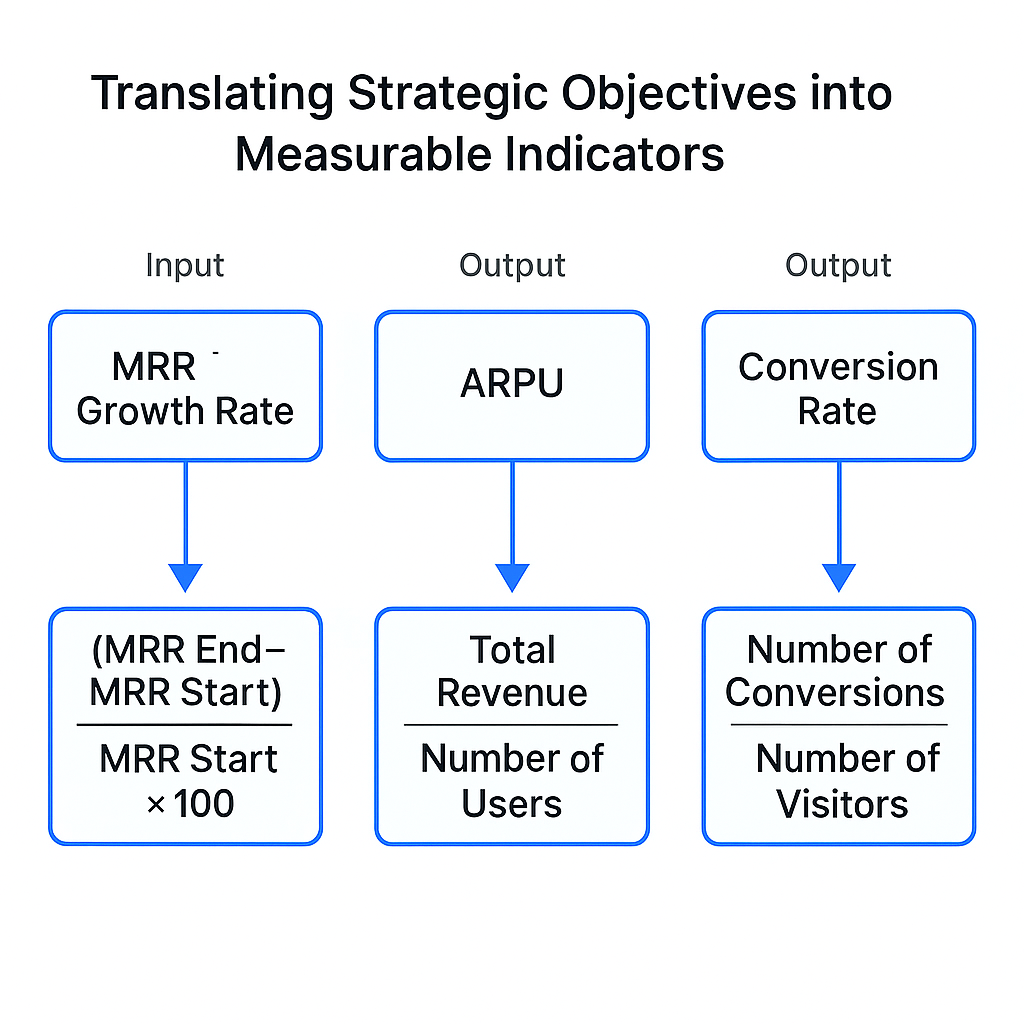
Translating Strategic Objectives into Measurable Indicators
The first step in selecting indicators is to unpack each business objective into discrete outcomes you can quantify. For example, “increase revenue” could translate into multiple KPIs:
- Monthly Recurring Revenue (MRR) growth rate
- Average Revenue Per User (ARPU)
- New customer conversion rate
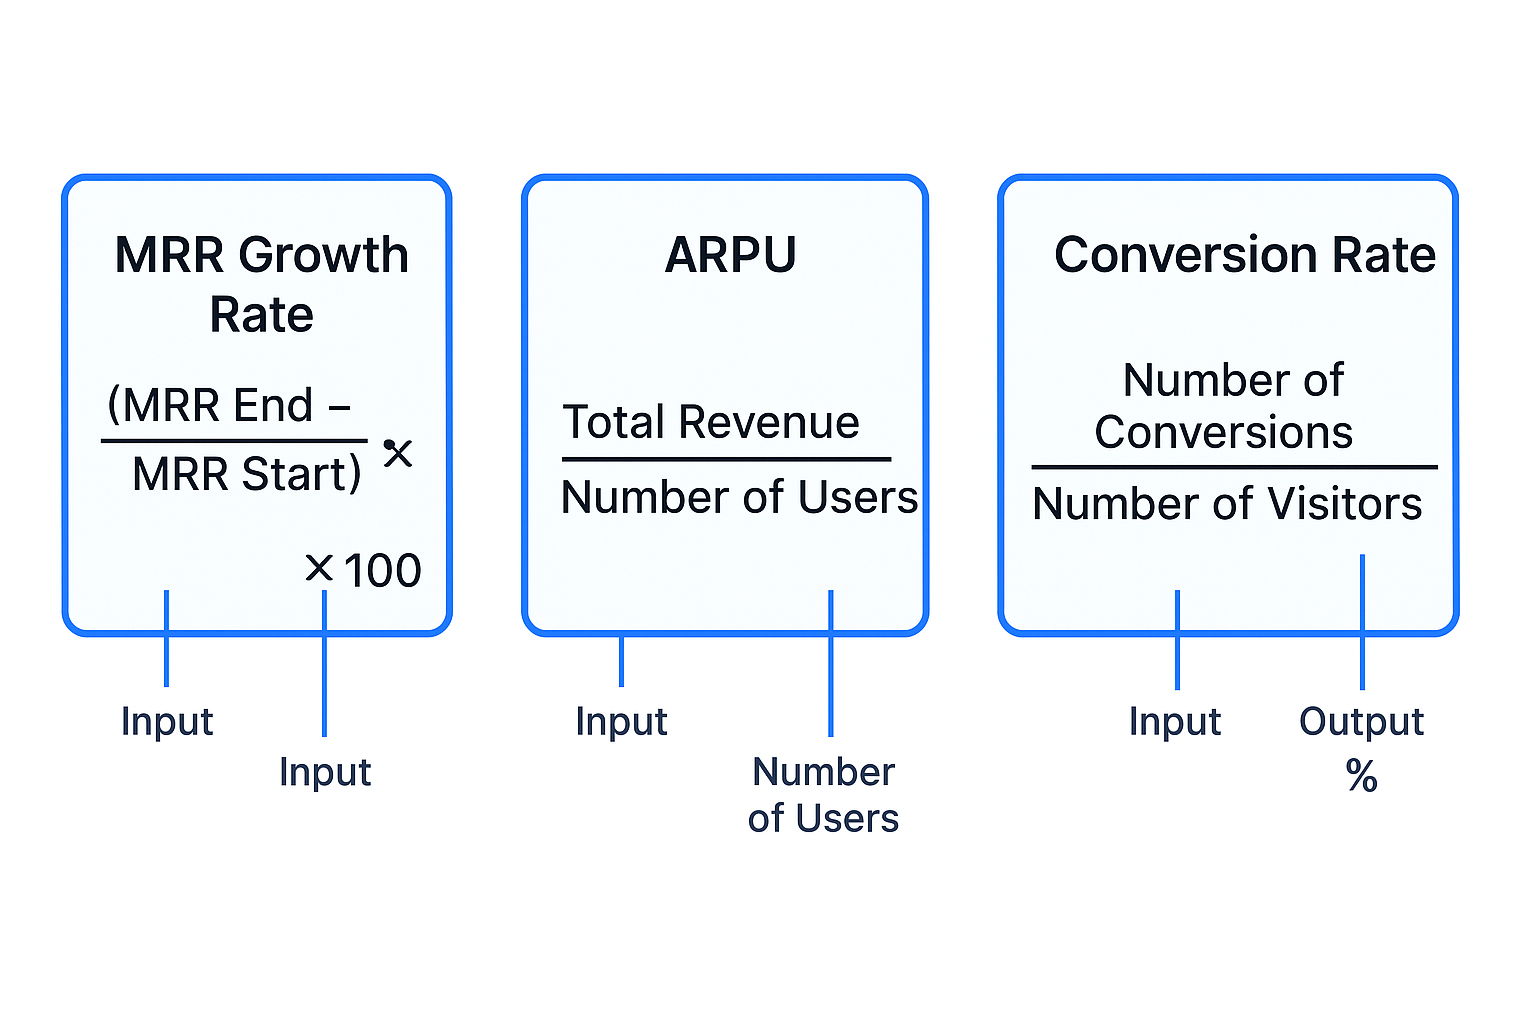
To work out MRR growth rate, take your current month’s MRR minus last month’s MRR, divide by last month’s MRR, and multiply by 100. That simple calculation shows you percentage growth. With ARPU, divide total revenue by active user count. Defining these formulas up front prevents ambiguity and ensures consistency across teams.
Selecting Performance Measures for Customer Retention
Customer retention often sits at the heart of subscription-based products or services. To choose metrics that matter:
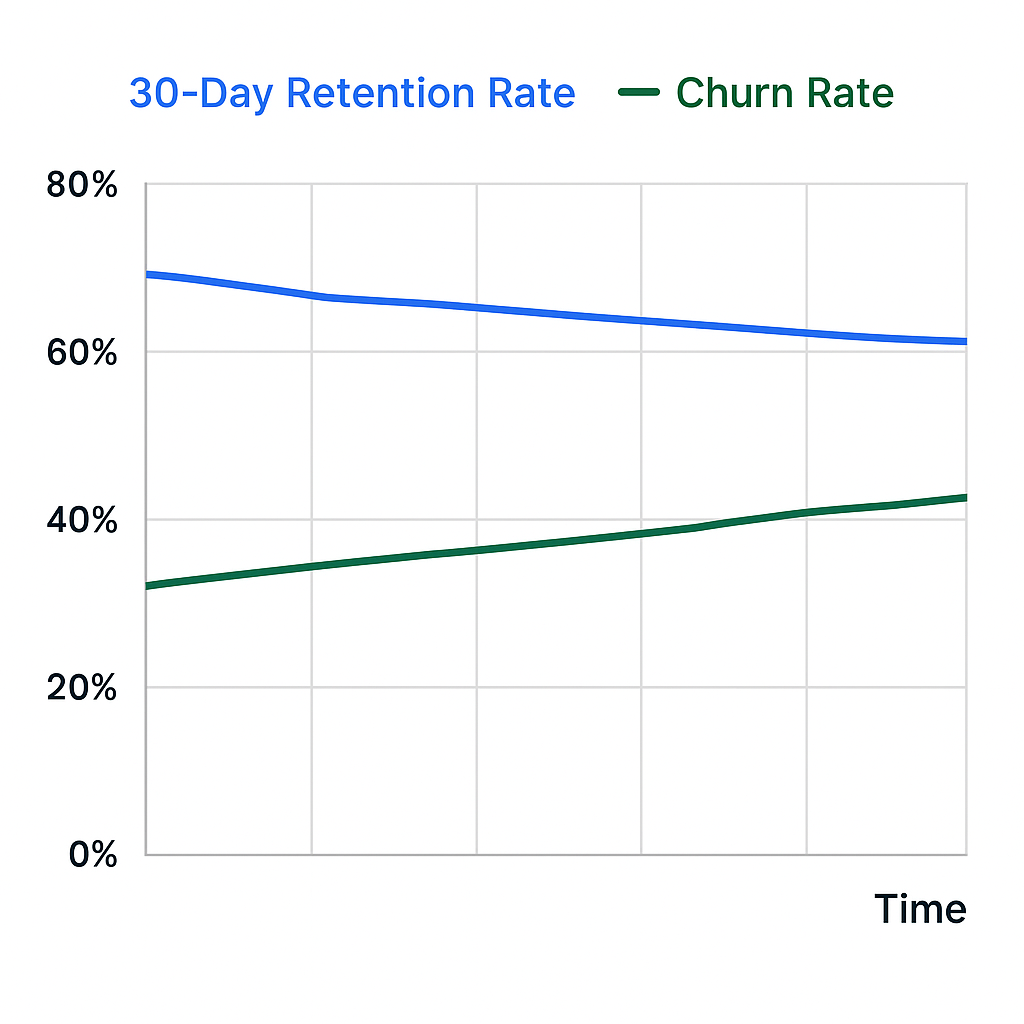
- 30-Day Retention Rate
Formula: (Number of users active on day 30 ÷ Number of users who signed up 30 days ago) × 100 - Churn Rate
Formula: (Customers lost in period ÷ Customers at start of period) × 100 - Net Promoter Score (NPS)
A qualitative-turned-quantitative measure gauging user loyalty through survey responses.

By establishing benchmarks for churn reduction—such as cutting monthly churn from 5% to 3% within six months—you create targets that motivate daily improvements in onboarding, support and feature engagement.
Choosing Indicators for User Engagement and Activation
Engagement KPIs help you understand how users interact with your product. Common measures include:
- Daily Active Users (DAU)
- Weekly Active Users (WAU)
- DAU/MAU Ratio (stickiness)
- Feature Adoption Rate
To calculate stickiness, divide DAU by Monthly Active Users (MAU) and express as a percentage. A rising ratio signals deeper user engagement. Feature adoption can be measured by tracking the percentage of newly registered users who use a specific feature within a set timeframe—critical for validating product-market fit and prioritizing development efforts.
Establishing Benchmarks for Conversion and Growth
Conversion metrics quantify how effectively your product guides prospects through the funnel. Key KPIs include:
- Trial-to-Paid Conversion Rate
- Free Trial Activation Rate
- Cart Abandonment Rate (for e-commerce)
- Lead-to-Customer Conversion
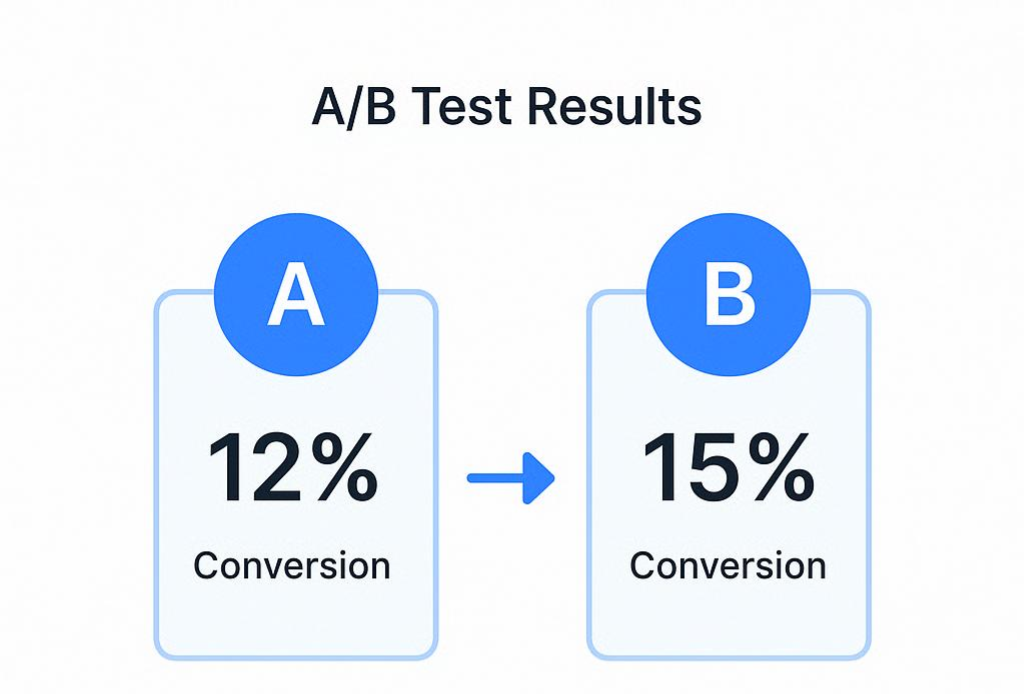
For trial conversions, divide the number of users who upgrade to paid plans by the total number of trial sign-ups. If you sign up 1,000 on trial and 120 convert, your conversion rate is 12%. Setting a benchmark—say improving from 12% to 15% in Q2—focuses marketing and product teams on optimizing onboarding flows and pricing experiments.
Setting Performance Targets with the SMART Framework
Once you’ve chosen the right indicators, articulate specific targets using the SMART criteria:
- Specific
“Grow MRR by 8% month over month” - Measurable
Data sources: Stripe analytics, CRM exports - Achievable
Based on historical growth of 6% per month - Relevant
Directly tied to the company’s revenue goal - Time-bound
Within the next quarter
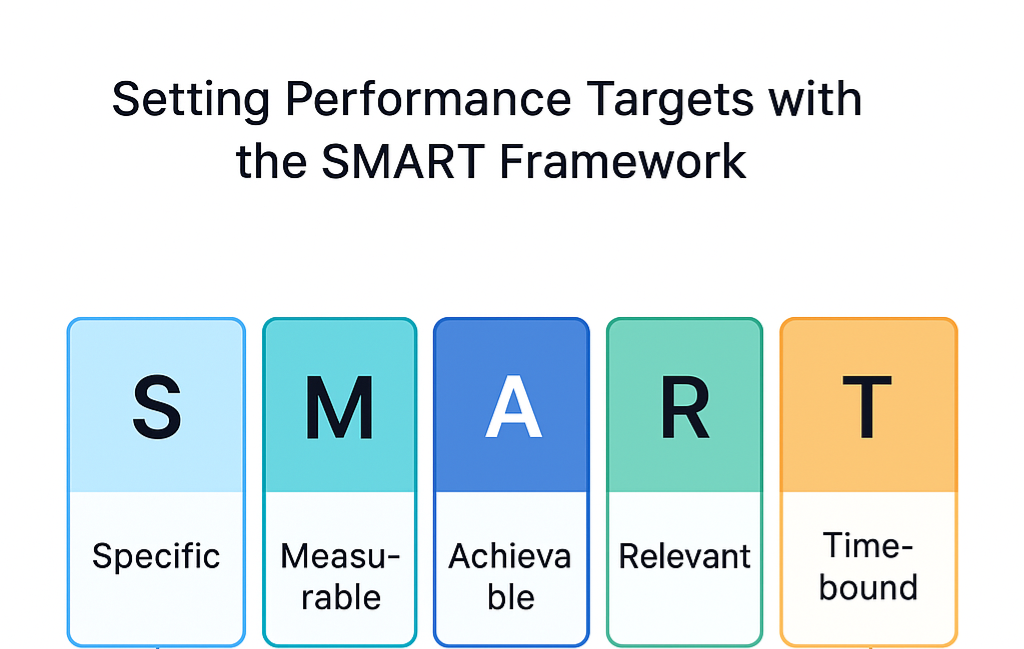
SMART targets prevent ambiguity. Instead of “increase user engagement,” you aim for “raise DAU/MAU stickiness from 15% to 20% by end of Q3,” giving your team a precise, motivating challenge.
Tools for Mapping Goals to KPIs
A variety of platforms simplify the process of selecting and tracking performance measures:
- Google Analytics
Segments users by behavior, goals and funnels. - Mixpanel or Amplitude
Event-driven analytics for granular cohort analysis. - Pendo or Productboard
Combines user feedback and feature adoption insights. - Segment
Centralizes event tracking and routes data to your BI tools. - OKR Management Tools (e.g., WorkBoard, Weekdone)
Enables objective alignment, KPI visibility and progress reporting.
Integrating these tools with your product roadmap ensures every new feature or experiment is tied back to a measurable business goal, creating an unbroken chain from planning to performance.
| Useful links |
|---|
| 📊 User & Event Analytics Google Analytics Track user behavior, set goals, and analyze funnels across web and app platforms. Mixpanel Offers real-time, event-based analytics with cohort segmentation and funnel tracking. Amplitude Powerful product analytics with behavioral insights, retention analysis, and experimentation tools. 🧭 Product Feedback & Feature Adoption Pendo Combines in-app analytics, user feedback, and guidance tools to improve product experience. Productboard Helps prioritize features based on user feedback and aligns product strategy with execution. 🔁 Data Routing & Integration Segment (by Twilio) Centralizes event tracking and routes clean, structured data to your analytics and BI tools. 🎯 OKR & KPI Management WorkBoard Enterprise-grade OKR platform with AI-powered strategy execution, scorecards, and alignment tools. Weekdone Lightweight OKR and weekly planning tool ideal for SMBs, with built-in feedback and reporting. |
Establishing Benchmarks Across Departments
Different teams require tailored performance indicators:
- Engineering
Cycle Time, Deployment Frequency, Mean Time to Recovery (MTTR) - Marketing
Cost Per Acquisition (CPA), Return on Ad Spend (ROAS), Click-Through Rate (CTR) - Sales
Lead Velocity Rate (LVR), Sales Qualified Leads (SQL), Average Deal Size - Customer Success
Customer Health Score, Time to Resolution, Upsell Rate
By selecting indicators that resonate with each function, you foster ownership and drive cross-functional alignment around unified business objectives. Regular cross-team workshops help ensure that each department’s benchmarks support the company’s top-line goals.
Visualizing Progress with Dashboards and Reports
Once performance measures are defined, real-time dashboards keep teams focused:
| Tool | Strengths | Use Case |
|---|---|---|
| Tableau | Advanced visualizations, SQL support | Executives’ high-level KPI review |
| Looker | Data modeling, embedded analytics | Product analytics and ad hoc queries |
| Power BI | Microsoft ecosystem integration | Operational reporting for IT and finance |
| Klipfolio | Drag-and-drop dashboards | Quick setup for marketing metrics |
| Geckoboard | Live TV-style data displays | All-hands metric screens |
Dashboards that combine your strategic KPIs—MRR growth, churn rate, DAU/MAU—provide a single source of truth. Pair quantitative dashboards with quarterly business reviews to discuss performance trends and course-correction.
| Useful links |
|---|
| 📈 Business Intelligence & Dashboarding Tools Tableau Advanced visualizations with SQL support. Ideal for executives reviewing high-level KPIs and strategic dashboards. Looker Offers robust data modeling and embedded analytics. Great for product analytics and flexible ad hoc querying. Power BI Deep integration with the Microsoft ecosystem. Suited for operational reporting across IT, finance, and enterprise teams. Klipfolio Drag-and-drop dashboard builder with spreadsheet familiarity. Quick to set up, especially for marketing metrics and client reporting. Geckoboard Real-time KPI dashboards designed for TV displays and team visibility. Perfect for surfacing live metrics in support, sales, and ops. |
From Strategy to Execution: Case in Point
Consider a SaaS startup whose primary goal was to boost annual recurring revenue (ARR) by 30%:
- Objective “Boost ARR”
- Selected indicators: MRR growth, trial-to-paid conversion, ARPU
- Benchmarks:
- MRR growth of 5% MoM
- 15% trial conversion within 14 days
- Increase ARPU from $45 to $55
- Tools:
- Amplitude for cohort conversion analysis
- Salesforce for ARR reporting
- Tableau for executive dashboards
Within six months, the startup hit a 32% ARR increase by continuously reviewing these KPIs, adjusting pricing tiers, and refining onboarding flows. This illustrates how aligning metrics with business goals—and selecting the right tools—drives sustainable growth.
By meticulously translating strategies into measurable indicators, choosing the right performance measures, setting SMART targets, and leveraging analytics platforms, product managers can ensure each feature and campaign advances the company’s strategic vision. Aligning metrics with business goals isn’t a one-time task—it’s a continuous practice that turns data into decisive action.
Engaging Stakeholders Through Metrics
Bringing stakeholders into the process of specifying performance indicators is crucial for buy-in, shared understanding, and actionable outcomes. When you define metrics in isolation, teams may lack context or commitment. By involving representatives from engineering, design, marketing, sales, customer success, and executive leadership, you ensure that every metric reflects real business priorities and user needs.
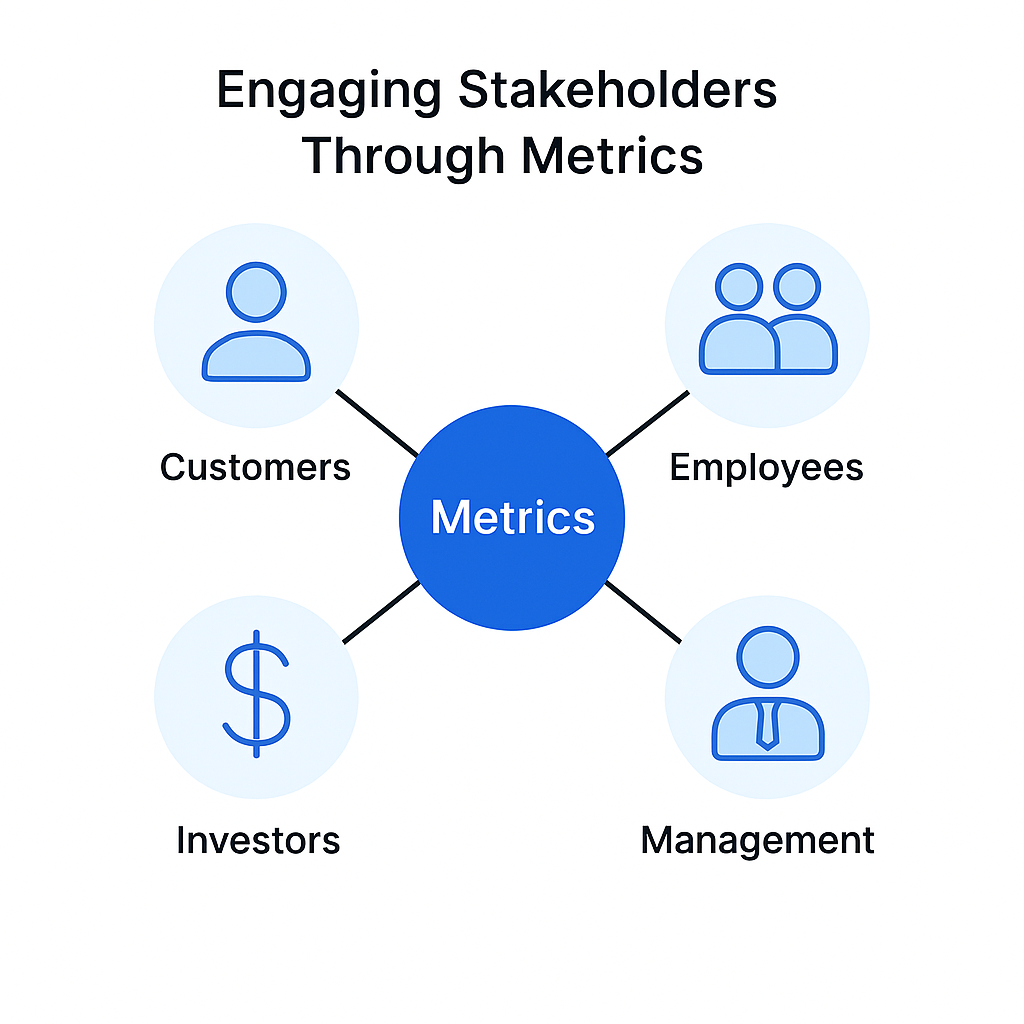
This collaborative approach reduces misalignment, accelerates decision-making, and builds a culture of transparency around how success is measured.
Establishing Success Indicators Collectively
Early in the product lifecycle, host a metrics kickoff workshop to outline objectives and surface everyone’s assumptions. Use the following agenda:
- Business Context Review: Share company goals and strategic themes.
- User and Market Insights: Present data on customer behavior, feedback and competitive benchmarks.
- Brainstorm Session: Invite each function to propose up to five candidate metrics.
- Consolidation: Group similar suggestions into thematic clusters (e.g., acquisition, engagement, retention).
- Draft Definitions: Agree on precise formulas, data sources and update cadences.
By the end of this session, you should have a preliminary set of 8–12 candidate KPIs, each with a clear definition. Document these in a shared “Metrics Playbook” that lives alongside the product roadmap.
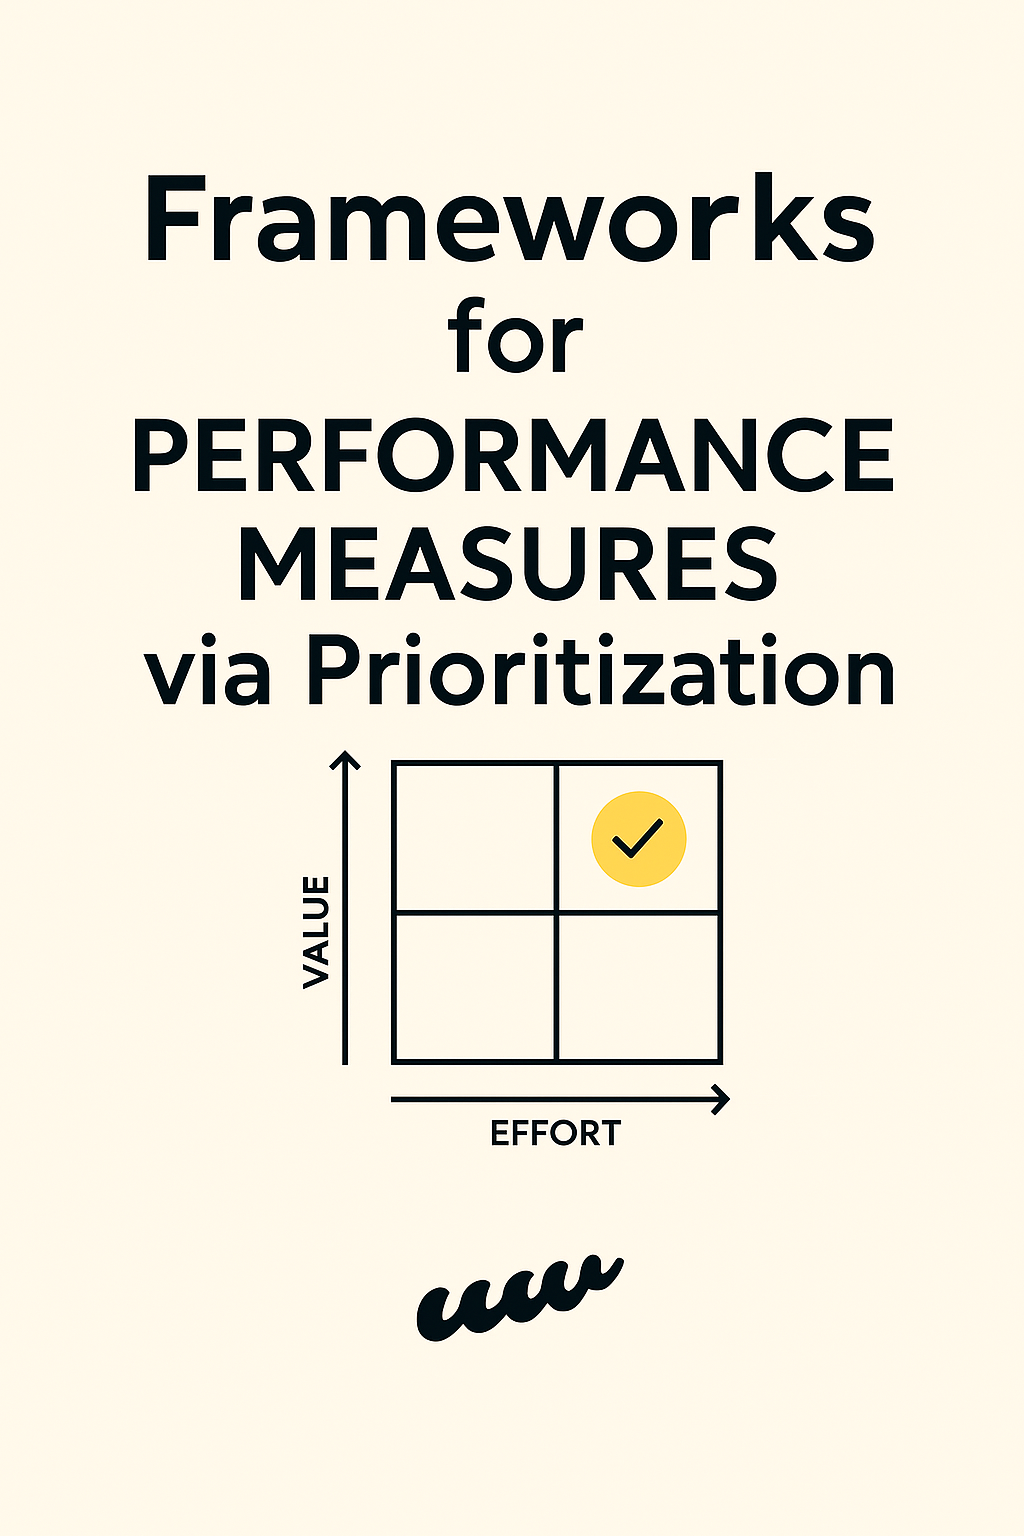
Selecting Performance Measures via Prioritization
Once candidate KPIs are drafted, apply structured prioritization techniques to focus your metrics on what truly moves the needle. Here are three powerful frameworks:
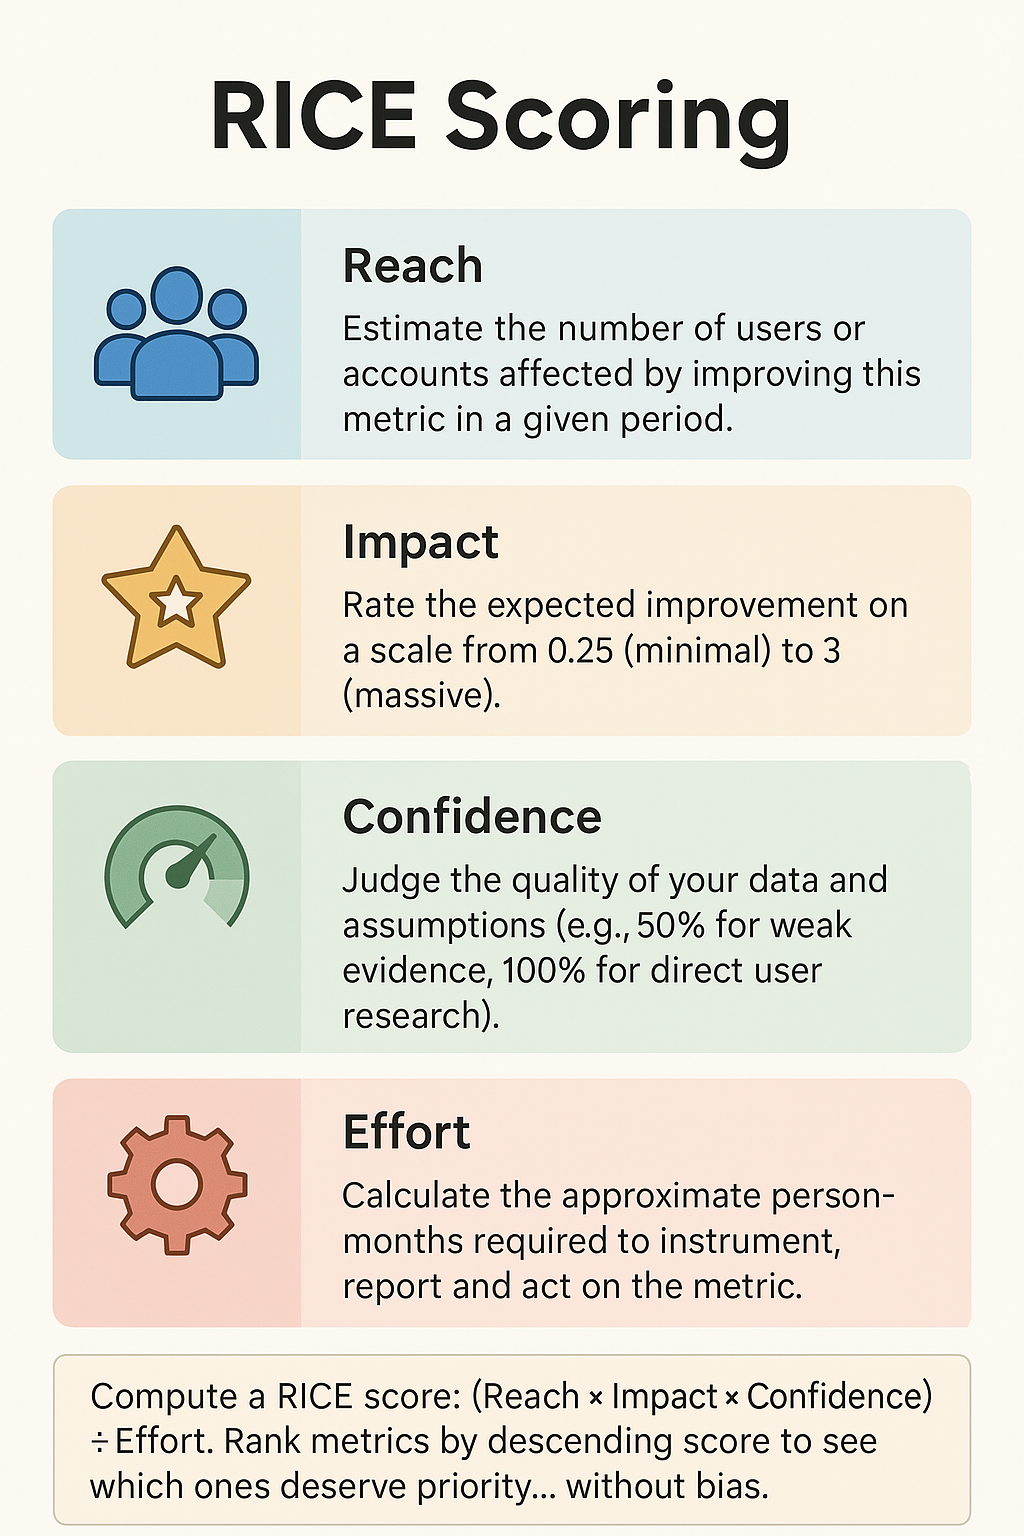
RICE Scoring
- Reach
Estimate the number of users or accounts affected by improving this metric in a given period. - Impact
Rate the expected improvement on a scale from 0.25 (minimal) to 3 (massive). - Confidence
Judge the quality of your data and assumptions (e.g., 50% for weak evidence, 100% for direct user research). - Effort
Calculate the approximate person-months required to instrument, report and act on the metric.
Compute a RICE score: (Reach × Impact × Confidence) ÷ Effort. Rank metrics by descending score to see which ones deserve priority… without bias.
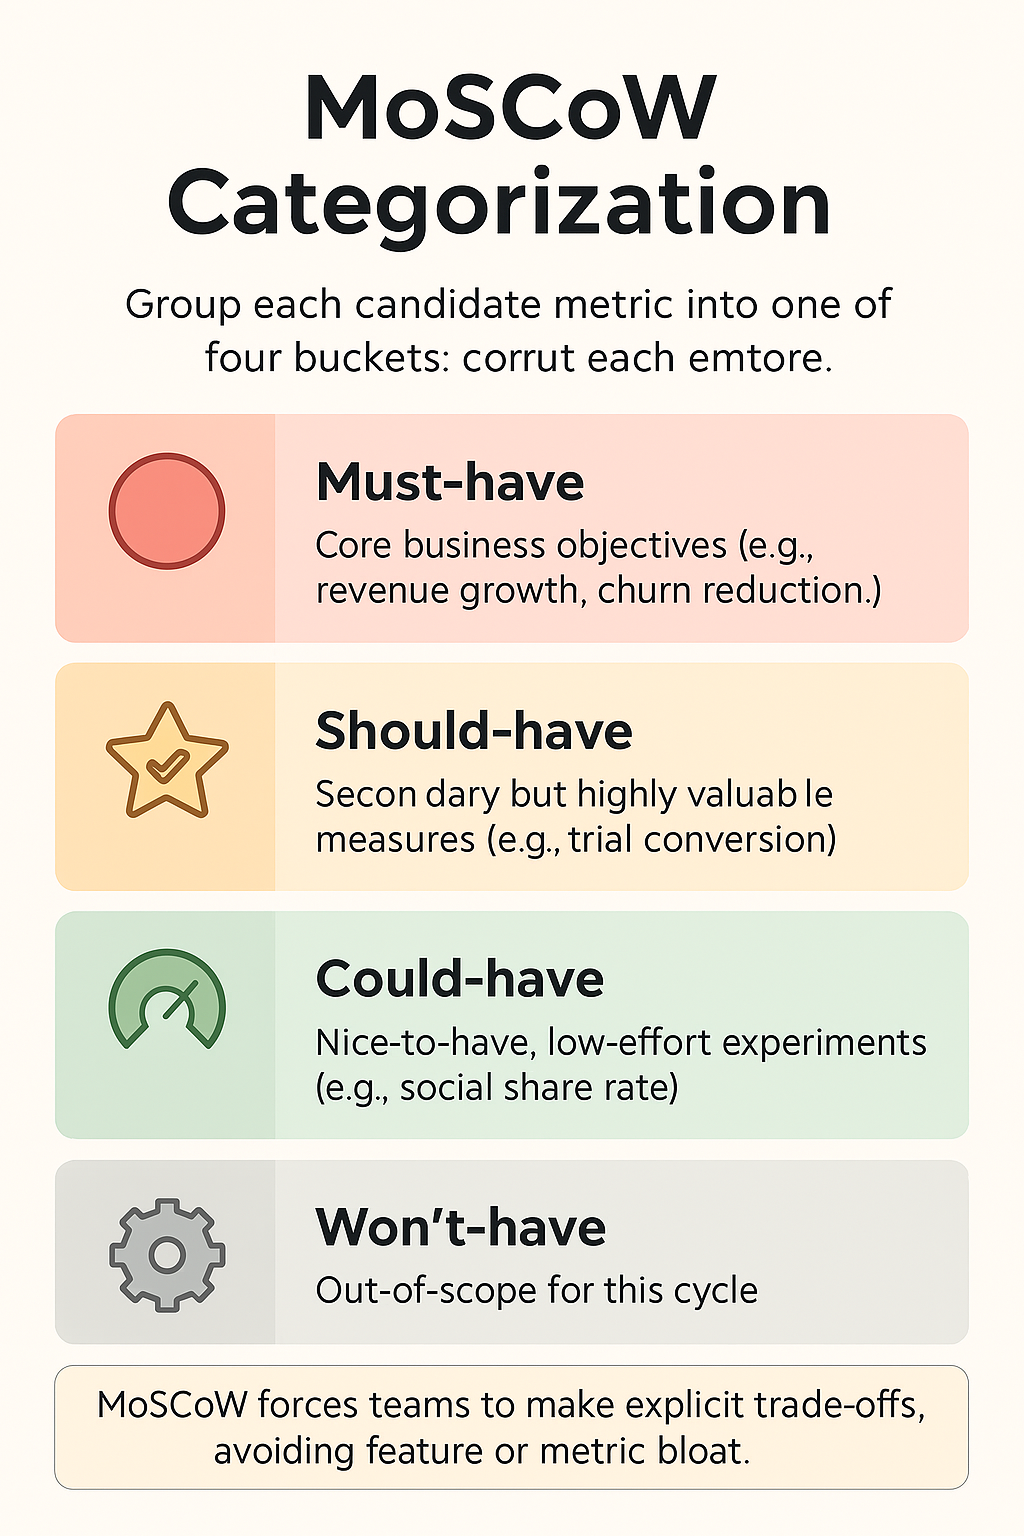
MoSCoW Categorization
Group each candidate metric into one of four buckets:
- Must-have: Core business objectives (e.g., revenue growth, churn reduction).
- Should-have: Secondary but highly valuable measures (e.g., trial conversion).
- Could-have: Nice-to-have, low-effort experiments (e.g., social share rate).
- Won’t-have: Out-of-scope for this cycle.
MoSCoW forces teams to make explicit trade-offs, avoiding feature or metric bloat.
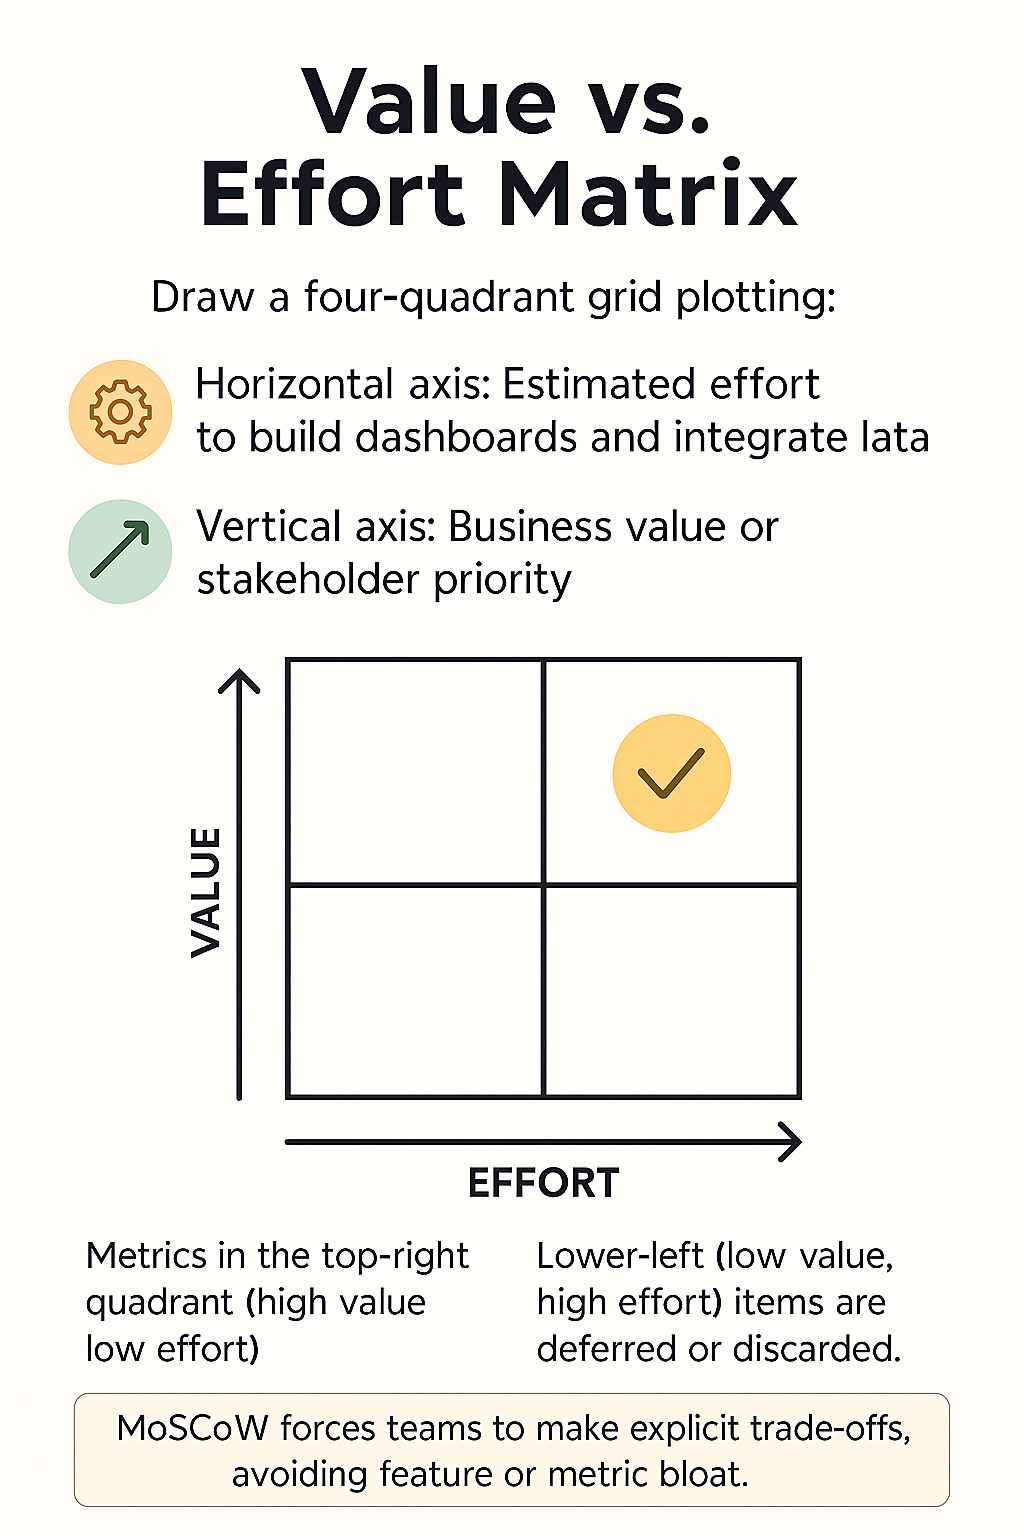
Value vs. Effort Matrix
Draw a four-quadrant grid plotting:
- Horizontal axis: Estimated effort to build dashboards and integrate data.
- Vertical axis: Business value or stakeholder priority.
Metrics in the top-right quadrant (high value, low effort) become your early wins. Lower-left (low value, high effort) items are deferred or discarded.
Tools to Facilitate Stakeholder Prioritization
Collaborative tools streamline workshops and decision-making:
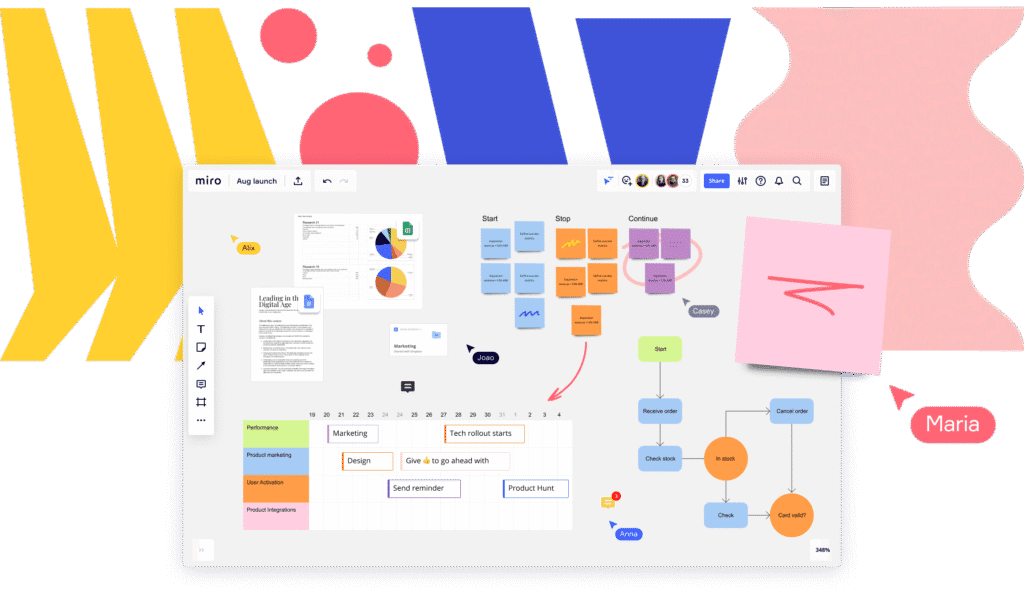
- Miro or MURAL
Infinite whiteboards for voting, affinity mapping and matrix plotting in real time. - Airtable or Notion
Track metric definitions, RICE scores, MoSCoW categories and ownership in a shared base. - Productboard or Roadmunk
Link feature ideas, user feedback and KPIs to product initiatives—visualizing alignment. - Kano Model Plugins
Assess metrics based on user delight vs. basic functionality, adding emotional resonance to your scorecards. - OKR Platforms (e.g., Perdoo, Weekdone)
Translate top-level objectives into aligned KRIs (Key Results Indicators) and monitor progress at scale.
Integrating these tools means no more spreadsheet chaos—every stakeholder sees live updates, comment threads, and decision histories.
| Useful links |
|---|
| 🧠 Collaborative Whiteboarding & Mapping Miro Infinite canvas for real-time collaboration. Ideal for affinity mapping, dot voting, and matrix plotting during workshops or retros. MURAL Visual work platform with facilitation tools like private mode, timers, and clustering. Great for remote ideation and team alignment. 🗂️ Metric Tracking & Prioritization Frameworks Airtable Flexible database meets spreadsheet. Use it to track RICE scores, MoSCoW categories, metric definitions, and ownership in a shared base. Notion All-in-one workspace for structured docs and databases. Great for linking prioritization frameworks to product specs and team rituals. 🧩 Product Strategy & Feedback Integration Productboard Centralizes feature ideas, user feedback, and KPIs. Visualize alignment with product initiatives and strategic objectives. Roadmunk Roadmapping tool with prioritization boards and feedback portals. Supports swimlane and timeline views for stakeholder alignment. 🎭 Emotional Scoring & User Delight KanoSurveys Run Kano model surveys to classify features by delight, performance, or indifference. Adds emotional nuance to prioritization. Kano Model Resources Educational hub for understanding and applying the Kano model in product development and scorecarding. 🎯 OKR & KPI Alignment Platforms Perdoo Combines OKRs, KPIs, and strategy maps in one platform. Ideal for aligning teams and tracking execution across the org. Weekdone Lightweight OKR and weekly planning tool with pulse surveys and 1:1s. Great for SMBs and team-level alignment. |
Integrating Feedback into Metrics Definition

Prioritization isn’t a one-and-done activity. After you roll out dashboards:
- Monthly Metric Reviews
Gather cross-functional teams to inspect trends, outliers and sudden shifts. - Iterative Refinement
If a metric isn’t yielding insights—perhaps it’s noisy or disconnected—retire or redefine it. - Stakeholder ‘Office Hours’
Host biweekly drop-in sessions where anyone can propose new signals or raise concerns. - Change Control Board
For major metric adjustments (new formulas, data source swaps), require sign-off from a governance council.
This ongoing governance process ensures your performance measures stay relevant and actionable as product goals evolve.
Communicating Outcomes and Next Steps
Effective stakeholder engagement culminates not just in agreed metrics but in shared accountability:
- Quarterly All-Hands
Showcase top 3 metrics, their current performance and planned experiments. - Executive Dashboards
Provide a one-page view for C-suite reviews, focusing on board-level priorities. - Team-Level Reports
Offer each function one or two tailored metrics, ensuring every squad sees its direct impact. - Public Metric Pages
For transparency, consider a subset of non-sensitive KPIs on internal sites or Confluence.
By closing the loop on stakeholder input—demonstrating how ideas shape metric selection and how metric outcomes drive roadmap pivots—you foster a powerful culture of data-driven collaboration.
Engaging stakeholders through metrics is an art and a science. With clear frameworks, collaborative tools, and continuous feedback loops, you’ll transform metric definition from a solitary task into an inclusive, value-focused practice that unlocks product success.
Identifying Metrics: Categories That Matter
With your high-level objectives and KPIs in place, it’s time to group measures into coherent families. Organizing metrics into categories makes it easier to balance user experience, engineering performance, financial health, and feature adoption. Below, we dive into four core metric categories—outcome, process, adoption, and financial—each illustrated with multiple examples and concise explanations.
| Metric | Description |
|---|---|
| Outcome Metrics | |
| Customer Lifetime Value (CLV/LTV) | Total revenue a single customer generates over their entire relationship with your product. |
| Net Promoter Score (NPS) | Gauges customer loyalty by asking how likely users are to recommend your product on a 0–10 scale. |
| Customer Satisfaction Score (CSAT) | Measures user satisfaction immediately after an interaction, typically via a 1–5 or 1–7 survey question. |
| Churn Rate | Percentage of customers who stop using your product during a given period. |
| Feature ROI | Compares revenue or cost savings generated by a feature against its development and maintenance costs. |
| Time to Value (TTV) | Time taken for new users to reach a key milestone (e.g., complete a transaction, send their first message). |
| Process Metrics | |
| Cycle Time | Time from work starting on a ticket to its deployment in production. |
| Lead Time | Total elapsed time from feature request to launch, covering backlog, planning, and development phases. |
| Deployment Frequency | Number of times code is released to production over a given period. |
| Mean Time to Recovery (MTTR) | Average time required to restore service after an incident or outage. |
| Defect Density | Number of bugs per thousand lines of code or per feature released. |
| Sprint Velocity | Average story points or tasks completed by the team in a sprint. |
| Code Churn | Percentage of code rewritten or deleted shortly after being added, indicating unstable requirements or design. |
| Adoption Metrics | |
| Daily Active Users (DAU) | Count of unique users engaging with your product each day. |
| Monthly Active Users (MAU) | Count of unique users engaging with your product at least once per month. |
| DAU/MAU Ratio (Stickiness) | Percentage of monthly users who return daily, indicating habitual use. |
| Activation Rate | Percentage of new sign-ups who complete a defined activation event (e.g., connect an account). |
| Onboarding Completion | Tracks user drop-off at each step of the onboarding flow to pinpoint friction points. |
| Time to First Value (TTFV) | Time for new users to achieve their first success (e.g., publish a post, create a project). |
| Feature Adoption Rate | Proportion of active users who use a specific feature within a set timeframe. |
| Cohort Retention | Retention comparison across user cohorts (e.g., by signup month or acquisition channel). |
| Financial Metrics | |
| Monthly Recurring Revenue (MRR) | Predictable monthly revenue from subscriptions, a key indicator of subscription business health. |
| Annual Recurring Revenue (ARR) | MRR multiplied by 12, used for high‐level planning and investor reporting. |
| Average Revenue Per User (ARPU) | Total revenue divided by the number of active users. |
| Customer Acquisition Cost (CAC) | Total marketing and sales spend divided by the number of new customers acquired. |
| LTV:CAC Ratio | Compares customer lifetime value to acquisition cost; ratios above 3:1 typically indicate profitable growth. |
| Gross Margin | (Revenue − Cost of Goods Sold) ÷ Revenue, showing the percentage of revenue retained after COGS. |
| Burn Rate | Cash spent by the company each month, used to calculate runway and financial sustainability. |
| Payback Period | Time required for a customer’s revenue to cover their acquisition cost. |
| Expansion MRR | Additional recurring revenue gained from existing customers through upsells, cross‐sells, or price increases. |
By cataloguing metrics into categories, you ensure balanced visibility across user behavior, business impact, and team performance.
Outcome Metrics
Outcome metrics capture the real-world results your product delivers—both to users and to the business. They measure the “why” behind every feature, surfacing whether you’ve achieved the impact you intended. Unlike process or adoption metrics, outcome metrics answer the ultimate question: did our product move the needle? When defining metrics, these measures validate your strategy, prioritize investments, and guide the continuous improvement loop.
Customer Lifetime Value (CLV or LTV)
Customer Lifetime Value estimates the total net revenue a customer will generate over their entire relationship with your product.
Formula:
CLV = (Average Purchase Value × Purchase Frequency) × Average Customer Lifespan − Customer Acquisition Cost
How it helps:
CLV reveals whether your acquisition and retention efforts justify the marketing spend. A rising CLV:CAC ratio signals efficient growth. CLV is critical for subscription businesses or products with repeat purchases, guiding decisions around pricing tiers, loyalty programs, and upsell strategies.
When to use:
Use CLV when you want to forecast long-term revenue streams, model pricing experiments, or justify additional budget for retention initiatives.
Net Promoter Score (NPS)
Net Promoter Score gauges user loyalty and advocacy by asking: “On a scale of 0–10, how likely are you to recommend our product?”
Calculation:
NPS = % Promoters (9–10) − % Detractors (0–6)
How it helps:
NPS correlates with retention, expansion revenue, and organic growth through word of mouth. Tracking NPS over time shows the health of your user base and guides product improvements that foster advocacy. Elevated NPS often precedes strong referral rates and lower customer support burdens.
When to use:
Implement NPS after major releases or quarterly to spot shifts in sentiment. Use follow-up surveys and marketing automation tools (e.g., Delighted, SurveyMonkey) to collect and analyze feedback.
Customer Satisfaction Score (CSAT)
Customer Satisfaction Score measures immediate sentiment after an interaction, feature launch, or support ticket resolution.
Typical survey: “How satisfied were you with [interaction/feature]? (1–5 or 1–7)”
How it helps:
CSAT highlights specific friction points in your product or service flow. By correlating CSAT dips with releases or onboarding changes, you can rapidly identify UX issues. CSAT is especially useful for support teams aiming to improve service quality and for product teams validating feature usability.
When to use:
Deploy CSAT after support interactions, key onboarding steps, or feature tutorials. Integrate with customer success platforms (e.g., Gainsight, Zendesk) to automate tracking and dashboarding.
Churn Rate
Churn Rate quantifies the percentage of customers who stop using your product over a given period.
Formula:
Churn Rate = (Customers at Start of Period − Customers at End of Period) ÷ Customers at Start of Period
How it helps:
High churn signals that your product isn’t delivering enough value or that onboarding needs refinement. Lowering churn improves repeat revenue and reduces acquisition pressure. Churn analysis by segment (e.g., by plan, geography, or acquisition channel) uncovers where improvements matter most.
When to use:
Track churn monthly or quarterly. Use cohort retention reports in analytics tools (e.g., Amplitude, Mixpanel) to diagnose patterns and test churn-reduction initiatives like personalized onboarding or loyalty incentives.
Feature ROI
Feature ROI compares the benefits delivered by a new feature against its development and maintenance costs.
Formula:
Feature ROI = (Revenue or Cost Savings Attributable to Feature − Cost of Feature) ÷ Cost of Feature
How it helps:
Quantifying feature ROI uncovers which investments drive the greatest business impact. It prevents teams from chasing shiny but low-impact ideas. Feature ROI is instrumental when prioritizing backlog items or justifying new hires and tech spending.
When to use:
Conduct ROI analysis six months to a year after feature release. Leverage revenue attribution tools (e.g., Heap, Looker) to link user actions to revenue changes.
Time to Value (TTV)
Time to Value measures how long it takes a new user to reach a critical success milestone, such as completing onboarding or executing a core workflow.
How it helps:
Shorter TTV correlates with higher activation rates and long-term retention. TTV helps you optimize onboarding flows, in-app tutorials, and user education. It’s particularly valuable for complex B2B tools where initial setup can be a barrier to adoption.
When to use:
Measure TTV by tracking time from signup to activation event in product analytics (e.g., Pendo, Amplitude). Experiment with guided tours, in-app messaging, and support resources to reduce TTV.
Product–Market Fit Score
Product–Market Fit Score assesses user sentiment around whether your product solves core problems better than alternatives. It often uses surveys asking: “How disappointed would you be if you could no longer use this product?”
How it helps:
A high PMF score (>40%) predicts accelerated growth, organic referrals, and lower churn. It validates your positioning and guides feature roadmaps. PMF surveys help identify under-served segments and tailor messaging to maximize adoption.
When to use:
Run quarterly PMF surveys during growth phases or pivot cycles. Use survey tools integrated with your CRM (e.g., Typeform, Intercom) to correlate responses with usage data.
Customer Health Score
Customer Health Score aggregates multiple signals—usage frequency, support tickets, NPS, and payment timeliness—into a single indicator of account viability.
How it helps:
Health scores enable customer success teams to proactively intervene with at-risk accounts before churn occurs. They also highlight upsell opportunities in accounts exhibiting high engagement and satisfaction.
When to use:
Calculate health scores weekly using customer success platforms (e.g., Gainsight, ChurnZero) that ingest data from your analytics, support, and billing systems.
Goal Completion Rate
Goal Completion Rate tracks the percentage of users who achieve defined product goals, such as publishing content, completing a challenge, or integrating a data source.
How it helps:
This metric aligns product design with user outcomes. By measuring goal completion, you verify that core workflows deliver value. Lower-than-expected rates reveal UX obstacles or feature misalignment.
When to use:
Use event-based analytics (e.g., Mixpanel, Google Analytics 4) to define and track key user goals. Review rates after each major release to ensure sustained performance.
Outcome metrics are the ultimate proof points of product success. By selecting and tracking measures that directly reflect customer value and business impact, product managers can prioritize effectively, justify investments, and drive continuous improvement. Integrate outcome metrics into executive dashboards, review them alongside process and adoption KPIs, and watch your product strategy evolve from intuition to insight.
Process Metrics
Process metrics shed light on how your teams execute work, maintain quality, and deliver features to market. They track the efficiency, velocity, and reliability of your development workflow—revealing bottlenecks and areas for improvement. Unlike outcome metrics, which focus on “what” you achieve, process metrics focus on “how” you achieve it. By monitoring these indicators, product managers can optimize cycle times, improve system stability, and ensure the engineering engine runs smoothly.
Cycle Time
Cycle Time
Cycle time measures the duration from when work begins on a task (e.g., a user story or bug) until it’s deployed to production. Shorter cycle times mean your team can iterate faster and deliver value more frequently.
How to calculate:
Cycle Time = Deployment Date – Work Start Date
Example:
If a feature ticket enters “In Progress” on March 1 and goes live on March 10, the cycle time is 9 days.
Why it helps:
- Highlights process bottlenecks—e.g., prolonged code reviews or testing delays.
- Tracks the impact of process changes (automation, improved handoffs).
- Aligns delivery cadence with business needs (e.g., two-week sprints vs. continuous deployment).
When to use:
Monitor cycle time weekly or per sprint. Integrate with JIRA or Azure DevOps to get automated reports and trend analyses.
Lead Time
Lead time captures the end-to-end elapsed time from when a feature is requested (e.g., ticket creation) to its release in production. It includes prioritization, design, development, QA, and deployment.
How to calculate:
Lead Time = Production Release Date – Ticket Creation Date
Example:
A customer submits a feature request on April 5; that feature ships on April 25. Lead time is 20 days.
Why it helps:
- Reveals gaps in backlog grooming and planning stages.
- Measures overall responsiveness to stakeholder and market demands.
- Enables realistic forecasting—if average lead time is 20 days, set expectations accordingly.
When to use:
Review lead time monthly. Use analytics features in GitLab or GitHub Enterprise to visualize request-to-release trends.
Deployment Frequency
Deployment frequency tracks how often your team releases code to production within a period—daily, weekly, or per sprint. High frequency often correlates with smaller, safer releases and better DevOps maturity.
How to calculate:
Count of production deployments per time frame (e.g., 30 days).
Example:
A mature CI/CD pipeline might deploy ten times per week; a less automated team may release once every two weeks.
Why it helps:
- Encourages incremental delivery, reducing risk per release.
- Validates DevOps improvements (automation, feature flags).
- Signals health of pipelines and rollback strategies.
When to use:
Track weekly deployments. Integrate with Jenkins, CircleCI, GitHub Actions, or GitLab CI dashboards.
Mean Time to Recovery (MTTR)
Mean time to recovery measures the average time it takes to restore service after a production incident or outage. It gauges system resilience and incident response effectiveness.
How to calculate:
MTTR = Total downtime duration ÷ Number of incidents
Example:
If three outages total 9 hours of downtime in a quarter, MTTR is 3 hours.
Why it helps:
- Assesses effectiveness of monitoring, alerting, and runbook quality.
- Drives investments in on-call training, chaos engineering, and failover strategies.
- Boosts stakeholder confidence by demonstrating robust incident handling.
When to use:
Monitor MTTR per sprint or monthly. Use tools like PagerDuty, Datadog, or New Relic to capture incident timelines and automate MTTR dashboards.
Defect Density
Defect density tracks the number of confirmed bugs relative to lines of code (LOC) or features released—highlighting code quality and test coverage gaps.
How to calculate (per release):
Defect Density = Number of confirmed defects ÷ Size of code delivered (e.g., KLOC)
Example:
A release with 100 KLOC and 50 defects yields a defect density of 0.5 bugs per KLOC.
Why it helps:
- Pinpoints modules or services with elevated error rates.
- Guides targeted investments in testing frameworks, code reviews, and pair programming.
- Offers early warning of technical debt accumulation.
When to use:
Analyze defect density per sprint or monthly release. Integrate with Sentry, Bugsnag, or JIRA to tag and quantify defects against commit history.
Sprint Velocity
Sprint velocity measures the average amount of work (story points or tasks) completed per sprint by a development team. It serves as a capacity planning and forecasting tool.
How to calculate:
Velocity = Sum of story points delivered ÷ Number of sprints
Example:
If a team completes 40 story points in Sprint 1, 35 in Sprint 2, and 45 in Sprint 3, average velocity is 40 points.
Why it helps:
- Enables realistic sprint planning—committing to work aligned with past performance.
- Tracks shifts in team output due to process changes or resource adjustments.
- Highlights when velocity dips—prompting root cause analysis (scope creep, dependencies).
When to use:
Review velocity every sprint. Use JIRA, Azure DevOps, or Rally Software to capture sprint metrics and generate velocity charts.
Code Churn
Code churn measures the percentage of code changed, rewritten, or deleted shortly after being added. High churn can signal shifting requirements, unstable architecture, or unclear specifications.
How to calculate:
Code Churn = (Lines of code deleted + Lines of code modified) ÷ Total lines added
Example:
If 1,000 lines are added in Sprint X, but 200 are deleted or modified in the next sprint, churn is 20%.
Why it helps:
- Identifies stories that require rework—often due to evolving requirements or ambiguous acceptance criteria.
- Signals architecture or design issues that need refactoring.
- Alerts product and engineering leaders to invest in improved specs, prototypes, or spike solutions.
When to use:
Monitor churn per sprint. Leverage GitPrime (Pluralsight Flow), CodeClimate Velocity, or GitHub’s analytics to track churn trends.
By tracking these process metrics—cycle time, lead time, deployment frequency, MTTR, defect density, sprint velocity, and code churn—product managers gain full visibility into the delivery engine. This empowers data-driven improvements, stronger stakeholder alignment, and a continuously optimized software delivery pipeline. Integrate these indicators into your dashboards, set targets, and iterate on your development practices to sustain high performance.
Adoption Metrics
Adoption metrics reveal how and when users embrace your product’s core value. They track the journey from initial sign-up through repeated, habitual use—uncovering whether customers integrate features into their workflows or lose interest. Monitoring adoption measures helps product teams validate onboarding flows, optimize feature rollouts, and pinpoint friction that stymies growth. Below, we explore ten essential adoption metrics, how to calculate them, in which contexts they matter, and the insights they unlock.
Daily Active Users (DAU)
Definition: The count of unique users who engage with your product on a given day.
How to calculate:
DAU = Number of unique users who performed at least one meaningful action in the last 24 hours.
Why it helps:
DAU indicates short-term engagement and is especially valuable for consumer apps, social platforms, or any product where daily habit formation drives value. A rising DAU signals strong reach and frequent use; a sudden drop may point to a release bug, downtime, or a disconnect in value.
When to use:
Track DAU during feature launches, marketing campaigns, or UI redesigns to assess immediate user response. Use DAU alongside MAU to calculate stickiness (see next metric).
Monthly Active Users (MAU)
Definition: Unique users engaging with your product at least once in a 30-day period.
How to calculate:
MAU = Number of unique users who performed any key action in the last 30 days.
Why it helps:
MAU measures overall reach and retention across a broader timeframe. It smooths daily volatility and is crucial for subscription services, SaaS dashboards, and any product where monthly check-ins drive renewal and upsell.
When to use:
Benchmark MAU before and after pricing changes, new onboarding flows, or strategic partnerships. Compare MAU to DAU to understand cadence of use.
Stickiness (DAU/MAU Ratio)
Definition: The percentage of monthly users who return on a typical day.
Formula:
Stickiness = (DAU ÷ MAU) × 100
Why it helps:
Stickiness gauges user habit formation. A ratio above 20–30% often indicates healthy daily engagement for consumer apps; for B2B SaaS, 5–10% may suffice if core tasks occur weekly. High stickiness correlates strongly with retention and advocacy.
When to use:
Use stickiness to compare segments—e.g., free vs. paid users, mobile vs. web—to optimize onboarding and identify under-engaged cohorts.
Activation Rate
Definition: The proportion of new users who complete a predefined “activation event” that signifies they’ve experienced core value.
Formula:
Activation Rate = (Users completing activation step ÷ New sign-ups) × 100
Why it helps:
Activation rate isolates onboarding effectiveness. If only 40% of sign-ups reach the first “aha” moment—such as uploading a first file or sending a first message—you know where to focus tutorials, in-app tips, and email sequences.
When to use:
Measure activation rate in the first 7–14 days after sign-up. Optimize flows when activation lags, A/B test CTAs, tooltips, and email drips to lift the rate.
Onboarding Completion Rate
Definition: Percentage of users who finish your structured onboarding sequence.
How to calculate:
Onboarding Completion = (Users who finish all onboarding steps ÷ Users who started onboarding) × 100
Why it helps:
Onboarding completion is a leading indicator of long-term retention. Missed steps often reveal confusing UI or unnecessary friction—fixing these can boost activation and reduce early churn.
When to use:
Track completion during rollout of new onboarding designs. Use heat maps (Hotjar, FullStory) and analytics (Heap, Amplitude) to pinpoint high-drop segments and optimize content or step order.
Time to First Value (TTFV)
Definition: The time taken from user sign-up to achieving the first meaningful outcome.
How to calculate:
TTFV = Timestamp when user achieves first success event − Timestamp of account creation
Why it helps:
Shorter TTFV correlates with higher activation and retention. In B2B tools with complex setup, TTFV may be days; in consumer apps, TTFV should be minutes. Reducing TTFV—via wizards, presets, or templates—accelerates user satisfaction.
When to use:
Segment TTFV by acquisition channel or persona. Identify channels that drive frustrated users (longer TTFV) and tailor onboarding or documentation for them.
Feature Adoption Rate
Definition: The percentage of active users who engage with a specific feature over a set period.
Formula:
Feature Adoption = (Users using feature ÷ Total active users) × 100
Why it helps:
Feature adoption reveals which parts of your product deliver perceived value. A new dashboard may have low initial uptake but can be resurrected with in-app announcements, tooltips, or focused training videos.
When to use:
After releasing a major feature or redesign. Track adoption weekly for the first month, then monthly to ensure continued usage. Use cohort analysis to see if early adopters become power users.
Cohort Retention Rate
Definition: The percentage of a user cohort (e.g., sign-ups in January) still active after N days.
How to calculate:
Retention Rate at Day N = (Cohort users active on day N ÷ Cohort size) × 100
Why it helps:
Cohort analysis isolates the effectiveness of experiments on specific user groups. If January sign-ups retained at 30 days outperform February’s, compare onboarding changes made in February.
When to use:
Run cohorts by acquisition source, plan type, or geographic region. Use tools like Mixpanel, Amplitude, or Google Analytics 4 for automated cohort reports.
Session Duration
Definition: The average time users spend engaging in a single session.
Formula:
Average Session Duration = Total time spent across sessions ÷ Total number of sessions
Why it helps:
Long sessions generally indicate engaged users exploring features or consuming content. But unusually long sessions may also signal confusion or difficulty completing tasks—paired with feature usage data, session duration uncovers context.
When to use:
Analyze session length in tandem with task completion rates. For onboarding, aim to tighten sessions by reducing redundant steps; for content-heavy apps, longer sessions may be a positive sign.
Putting Adoption Metrics into Practice
- Build an Adoption Dashboard
Combine key metrics (DAU, activation rate, TTFV, feature adoption) in a real-time dashboard (Looker, Tableau, Power BI) to spot trends at a glance. - Define Healthy Benchmarks
Reference industry norms—consumer apps often target 20% stickiness; SaaS tools may settle around 5–10%. Adjust benchmarks by user segment. - Conduct Adoption Workshops
Quarterly cross-functional reviews involving product, UX, marketing, and customer success teams help align on adoption goals, root-cause analysis, and action plans. - Iterate Rapidly
Experiment with in-app guides (Pendo, WalkMe), email sequences, and UI tweaks. Measure metric changes per experiment to continuously refine the user journey. - Tie Adoption to Revenue
Map adoption segments to LTV and churn. High adopters often yield higher expansion MRR; low adopters present churn risk—prioritize re-engagement campaigns accordingly.
By tracking these adoption metrics, product managers gain a 360° view of how users discover, activate, and incorporate your product into daily routines. Use them to validate hypotheses, prioritize feature investments, and steer cross-functional teams toward building experiences that users truly value.
Financial Metrics
Financial metrics quantify the economic health and scalability of your product business. While outcome metrics focus on user value, financial metrics translate product performance into revenue, cost efficiency, and profitability. They help product managers justify investments, optimize pricing, manage cash flow, and align product roadmaps with shareholder expectations. When you’re defining metrics, financial indicators ensure you balance growth objectives with sustainable unit economics and capital stewardship.
Monthly Recurring Revenue (MRR)
Definition
Predictable revenue earned each month from active subscriptions.
Formula
MRR = Σ (Monthly Subscription Fee per Customer)
How it helps
MRR provides a real-time pulse on top-line growth. Tracking MRR highlights seasonal trends, informs revenue forecasting, and validates the impact of pricing changes, new tiers, or retention initiatives.
When to use
Use MRR to benchmark launch campaigns, trial-to-paid conversion experiments, and tier optimizations. A stable upward MRR trend signals product-market fit in subscription businesses.
Annual Recurring Revenue (ARR)
Definition
Subscription revenue normalized to a 12-month period.
Formula
ARR = MRR × 12
How it helps
ARR converts monthly snapshots into a longer-term view for executives and investors. It smooths out short-term volatility and supports annual budgeting, resource allocation, and fundraising decisions.
When to use
Report ARR in quarterly or annual business reviews. Use it to model multi-year growth scenarios and to compare performance against peers.
Average Revenue Per User (ARPU)
Definition
Average monthly or annual revenue generated by each active user.
Formula
ARPU = Total Revenue ÷ Number of Active Users
How it helps
ARPU uncovers monetization health. Rising ARPU indicates successful upsells, cross-sells, or effective pricing tiers. Declining ARPU can flag discount overuse or unintended user mix shifts.
When to use
Monitor ARPU by cohort (e.g., acquisition source, plan tier). Launch premium features and track ARPU changes to validate willingness to pay.
Customer Acquisition Cost (CAC)
Definition
Average cost to acquire one new paying customer.
Formula
CAC = Total Sales & Marketing Spend ÷ Number of New Customers
How it helps
CAC measures efficiency of acquisition channels. When combined with LTV, it reveals whether you’re overspending on ads or need to improve funnel conversion.
When to use
Calculate CAC monthly or per campaign. Optimize ad creatives, landing pages, and sales processes by comparing CAC across channels (search, social, content).
LTV:CAC Ratio
Definition
Compares customer lifetime value to acquisition cost.
Formula
LTV:CAC = Customer Lifetime Value ÷ Customer Acquisition Cost
How it helps
A ratio above 3:1 typically indicates profitable growth; below 1:1 signals unsustainable acquisition. It guides budgeting: should you double down on channels with low CAC or optimize product to boost LTV?
When to use
Use LTV:CAC in investor decks and finance reviews. Experiment with retention initiatives or pricing changes and observe ratio shifts.
Gross Margin
Definition
Percentage of revenue retained after direct costs of goods sold (COGS).
Formula
Gross Margin = (Revenue − COGS) ÷ Revenue × 100
How it helps
High gross margins free up funds for R&D, marketing, and ops. Low margins highlight inefficient hosting, support, or production costs, prompting cost-reduction measures.
When to use
Monitor gross margin per product line or region. Use it to price new features or geographic expansion, ensuring unit economics remain favorable.
Burn Rate
Definition
Rate at which cash is spent each month.
Formula
Burn Rate = Cash Balance at Start of Period − Cash Balance at End of Period
How it helps
Burn rate indicates runway—how many months you can operate before new funding is required. It drives decisions on hiring, marketing spend, and feature scope to preserve cash.
When to use
Track burn rate weekly or monthly. Combine with pipeline forecasts to determine fundraising timing and growth-rate trade-offs.
Payback Period
Definition
Time for a customer’s revenue to cover their acquisition cost.
Formula
Payback Period = CAC ÷ Monthly Gross Profit per Customer
How it helps
Shorter payback periods reduce financing needs and increase capital efficiency. It prioritizes acquisition channels that quickly recoup spend, aligning growth with cash flow stability.
When to use
Calculate payback period for each acquisition channel. If one channel’s payback exceeds your target runway, shift budget to faster-payback sources.
Operating Cash Flow (OCF)
Definition
Cash generated by core business operations.
Formula
OCF = Net Income + Non-Cash Expenses + Changes in Working Capital
How it helps
OCF reveals real-world liquidity beyond accounting profits. Positive OCF funds growth, debt service, or dividends without external financing, while negative OCF signals potential cash crunch.
When to use
Monitor OCF monthly. Use tools like QuickBooks or NetSuite to generate cash flow statements; investigate dips by analyzing receivables, payables, or inventory cycles.
Contribution Margin Ratio
Definition
Percentage of revenue remaining after covering variable costs.
Formula
Contribution Margin Ratio = (Revenue − Variable Costs) ÷ Revenue × 100
How it helps
This ratio isolates the incremental profit from each sale before fixed costs. It guides pricing strategy and helps determine break-even volume for new features or products.
When to use
Apply contribution margin when evaluating bundling, discounts, or pay-per-use pricing models. Use it in break-even analysis and go/no-go decisions for product experiments.
Expansion MRR
Definition
Additional recurring revenue from existing customers through upsells, cross-sells, or price increases.
Formula
Expansion MRR = MRR Growth from Existing Accounts
How it helps
Healthy expansion indicates strong product adoption and satisfaction. It reduces reliance on new customer acquisition and accelerates net-negative churn—where expansion outpaces cancellations.
When to use
Report expansion MRR alongside new MRR. Use CRM data (Salesforce, HubSpot) to segment accounts by expansion behavior and tailor success outreach.
Quick Ratio
Definition
Liquidity metric measuring ability to meet short-term obligations without inventory.
Formula
Quick Ratio = (Current Assets − Inventory) ÷ Current Liabilities
How it helps
A quick ratio above 1.0 indicates sound short-term liquidity. For SaaS companies, substituting deferred revenue for inventory provides a view of immediate cash conversion capacity.
When to use
Calculate quick ratio in financial close. Use it to set credit terms, manage vendor payments, and maintain operational flexibility.
Financial metrics form the cornerstone of accountable, capital-efficient product management. By defining metrics that matter across revenue, costs, liquidity, and profitability, you’ll equip stakeholders with clarity and drive strategic decisions grounded in fiscal reality. Use these indicators to balance ambition with sustainability, delivering growth that endures.
Setting Performance Indicators
After identifying metrics, focus on setting performance indicators that are realistic and motivating. This stage of defining metrics transforms raw measures into targets.
Applying SMART Criteria
Ensure each KPI is:
- Specific: Clear on what you measure
- Measurable: Quantifiable with data sources
- Achievable: Realistic given resources
- Relevant: Directly tied to goals
- Time-bound: Set within a timeframe
SMART indicators drive accountability and focus.
Balancing Qualitative and Quantitative Insights
While numeric KPIs are essential, qualitative feedback—surveys, interviews, usability tests—adds context. Combine metrics with user stories to form a holistic view of success.
Avoiding Vanity Metrics
Resist the allure of flashy numbers (e.g., total app downloads) that don’t correlate with business impact. Defining metrics means choosing measures that drive decisions.
Benchmarking Measures for Continuous Improvement
Benchmarking measures offers perspective on performance. Once you’ve defined metrics, compare them to:
- Industry Benchmarks
Leverage reports from sources like Amplitude or Gartner. - Internal Baselines
Use historical data to set realistic targets. - Competitive Data
Public reports and case studies reveal where peers excel.
Benchmarking ensures your targets are neither too timid nor unreachably ambitious.
Tools and Techniques for Defining Metrics
Below is a curated list of essential tools and prioritization techniques to define and manage your product metrics effectively.
| Tool/Technique | Key Features | Short Review |
|---|---|---|
| Google Analytics | Traffic analysis, goal funnels, event tracking | Ubiquitous web analytics; quick to set up but limited for granular product events |
| Mixpanel | Event-based analytics, cohort analysis, retention | Flexible product analytics; steeper learning curve and can get costly at scale |
| Amplitude | User behavior insights, journey mapping, experimentation | Intuitive UI with powerful cohorts; premium pricing may deter smaller teams |
| Tableau | Drag-and-drop visualization, SQL integration | Enterprise-grade BI; handles large data sources but requires data-prep expertise |
| Looker | Data modeling, embedded dashboards, custom metrics | Scalable analytics platform; developer-friendly but expensive |
| Power BI | Real-time dashboards, Microsoft ecosystem integration | Affordable and integrates well with Office 365; less flexible with non-MS sources |
| Productboard | Feedback management, roadmap alignment, prioritization | Centralizes customer feedback and links features to goals; subscription cost is high |
| Aha! | Strategy planning, idea portal, release management | Robust roadmapping features; can be overwhelming for smaller teams |
| Miro | Collaborative whiteboards, templates, voting plugins | Excellent for remote metric workshops and affinity mapping; license needed for teams |
| RICE Scoring | Reach, Impact, Confidence, Effort formula | Quantitative prioritization that balances opportunity and resources |
| MoSCoW Prioritization | Must-have, Should-have, Could-have, Won’t-have grouping | Simple classification to force critical trade-offs; works well in time-boxed sprints |
| Value vs Effort Matrix | Visual plotting of business value vs implementation effort | Rapidly identifies quick wins; subjective scoring requires consensus |
| SMART Criteria | Specific, Measurable, Achievable, Relevant, Time-bound | Universal goal-setting for clear, accountable targets |
Integrate these tools and techniques into your workflow to automate metric definition, track performance in real time, and focus your roadmap on high-impact outcomes.
Best Practices to Ensure Metrics Success
To embed metrics culture:
- Conduct Regular Reviews
Monthly or quarterly metric deep-dives keep teams aligned. - Foster Cross-Functional Collaboration
Involve stakeholders in metric ideation and interpretation. - Document Metric Definitions
Maintain a centralized glossary, detailing data sources and calculation methods.
Consistency and transparency amplify trust in your metrics.
Common Pitfalls in Defining Metrics
Avoid these traps:
- Overcomplication
Track too many measures and lose focus. - Data Quality Issues
Inaccurate or incomplete data undermines credibility. - Ignoring Context
Metrics without story lead to misinterpretation.
Steer clear of pitfalls by prioritizing clarity and data integrity.
Conclusion

Defining metrics transforms guesswork into strategic action. By aligning KPIs with business objectives, categorizing measures, and setting SMART targets, product managers can steer products toward success. Commit to regular reviews, uphold data hygiene, and leverage industry benchmarks. As you refine your metrics practice, you’ll unlock deeper insights, drive stakeholder confidence, and build products that truly resonate.
Embrace the art and science of defining metrics, and watch your product thrive.